Hamden in the Census
Revised September 2021
by Paul Saubestre
The population of Hamden was recorded as 61,169 in the 2020 United States Census, an increase of 209 or 0.3% above the 2010 count. This was the smallest increase in absolute terms since the 1830s, and the smallest percentage increase ever in the 230-year history of the census, although the population actually decreased in the 1810s and 1820s. This was part of a trend across Connecticut, with most of the largest cities, except Hartford, showing significant population gains, and small to medium-sized towns, except in Fairfield County, showing very small gains or losses. Hamden slipped from eleventh to twelfth in statewide municipal population rank, the 12th spot taken by Fairfield.
The census showed increasing racial and ethnic diversity across the nation, and Hamden was no exception. The percentage of the population identifying as the White race only decreased over the past decade from 68% to 56%. The percentage of any race identifying as Hispanic or Latino ethnicity increased from 9% to 13%. As in much of the state, Hamden saw a decrease in population of children over the decade, those under age 18 declining from 19% to 17%. Breakdown by gender for the 2020 census has not yet been released, but the latest 2019 estimates showed little change from 2010.
The Mt. Carmel neighborhood was the only one showing a significant decrease in population, but that was largely caused by Quinnipiac University students leaving campus at the start of the COVID-19 pandemic, just before the April 1, 2020 date of the census. Whitneyville and Hamden Plains saw noticeable increases due to the construction of an apartment complex in each of those neighborhoods. Population trends in other neighborhoods continued as in the past few decades.
|
 |
| CLICK on the image to enlarge it. |
|
|
The town of Hamden was just four years old when the first census was taken in 1790. The complete record of Hamden in that census filled just ten small handwritten pages, with the names of the head of each household and the number of persons in it broken down in five categories. These last two pages show the names of many families who remained in Hamden long after, some of them names of streets today: Munson, Woodin, Gilbert, Alling, Mix, Dickerman, Humiston, Attwater, Cooper, and Ford. The total number of inhabitants was 1422.
|
Since Hamden was primarily an agricultural town in the early nineteenth century, the population remained fairly constant, less than 2000. The growth of manufacturing later in that century led to steady population growth. Immigration in the early twentieth century led to much faster growth, which then slowed in the Great Depression and World War II. The postwar baby boom accelerated growth again, which has since leveled off.
|
Racial Distribution The census records demographic data for every resident, including race, gender, and age. Totals in each of these categories are reported for states, counties, cities, and other incorporated areas. Unfortunately, Hamden is not fully recognized as an incorporated area, so some of this information is not readily available for some census years. Race has been characterized in various ways over the history of the census. The only categorization possible over all censuses is White and non-White. These graphs show the number of each for the censuses for which the data is available, indicated by the dots, and the percentage of non-White.
|
Gender Distribution The following graph shows the percentage of male population. It grew with the rise of agriculture in the early nineteenth century, then dropped sharply due to Civil War casualties. More men joined the industrial workforce late in that century, before steady decline in the twentieth century.
|
Age Distribution Population by age is readily available for only a few censuses, and not always for the same age ranges. The very high percentage of children at the founding of the town fell in the following decades. It rose again in the post-World War II baby boom, and declined at the start of this century.
|
Neighborhood Distribution Hamden, more than most towns, is composed of separate villages and neighborhoods. The 1880 census recorded the population of unincorporated places, noting that “the figures can be considered as only approximate, as the limits of such places are not sharply defined.” Hamden had more such places than most towns, five:
Augerville 62
Centreville [so spelled] 191
Hamburg [Highwood] 477
Ivesville [Mt. Carmel] 474
Whitneyville 196
Most town residents lived outside these areas. Subtracting these figures from the total population that year leaves 2008 people in the rest of the town.
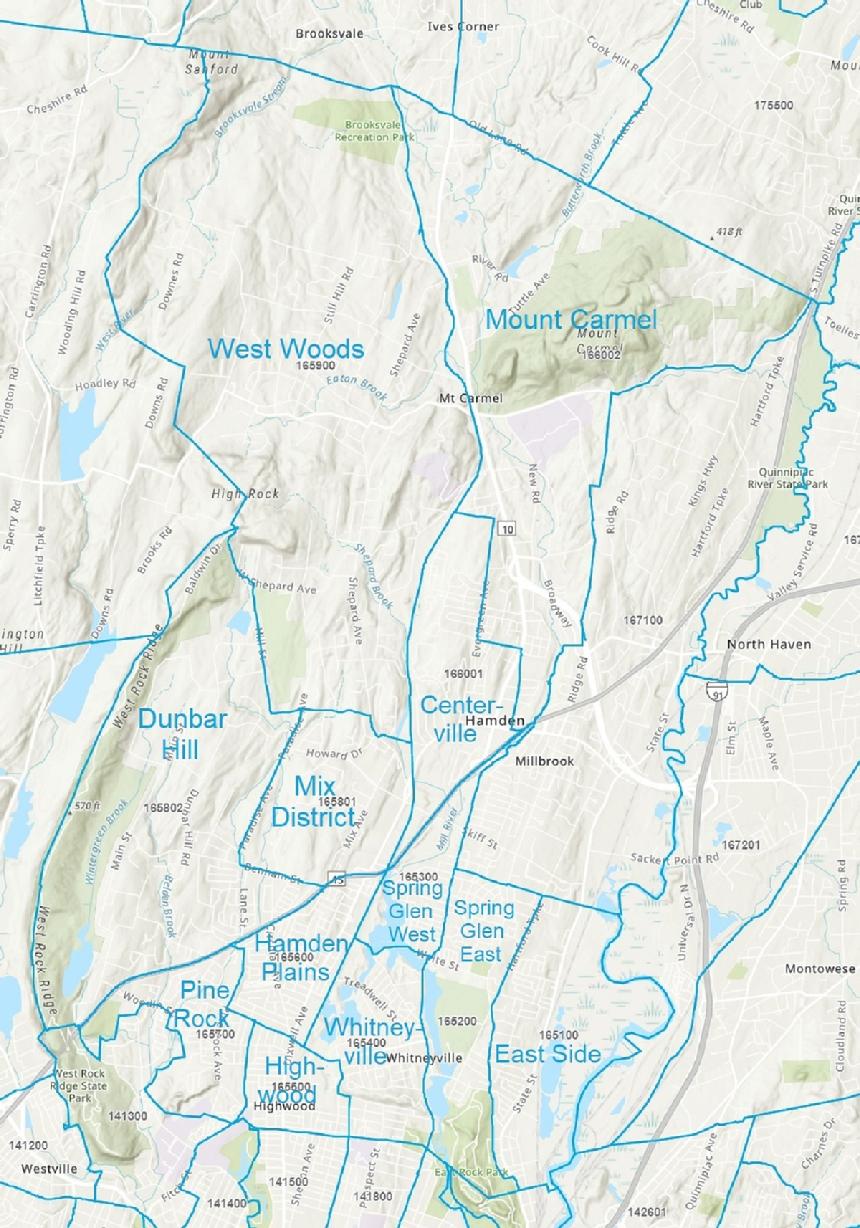
Hamden was first divided into nine census tracts for the 1960 census. One of them was divided in two for the 1970 census, and there were twelve tracts by 2000, as shown on this map:
|
 |
| CLICK on the image to enlarge it. |
|
|
This graph shows the population in each tract since 1960. The tracts that were combined in the 1960 census are kept together in all years, and the two Spring Glen tracts are combined since they are considered one neighborhood with approximately the same population as the others. The tracts north of the parkway grew rapidly throughout the period, while the southern ones remained about the same or decreased slightly.
|
| For printable pdf of this article click
on the desired format link below
|
_______________________________________________________________________________________________________
|
|